- Mean: The mean for grouped data can be found by :
(i) The direct method =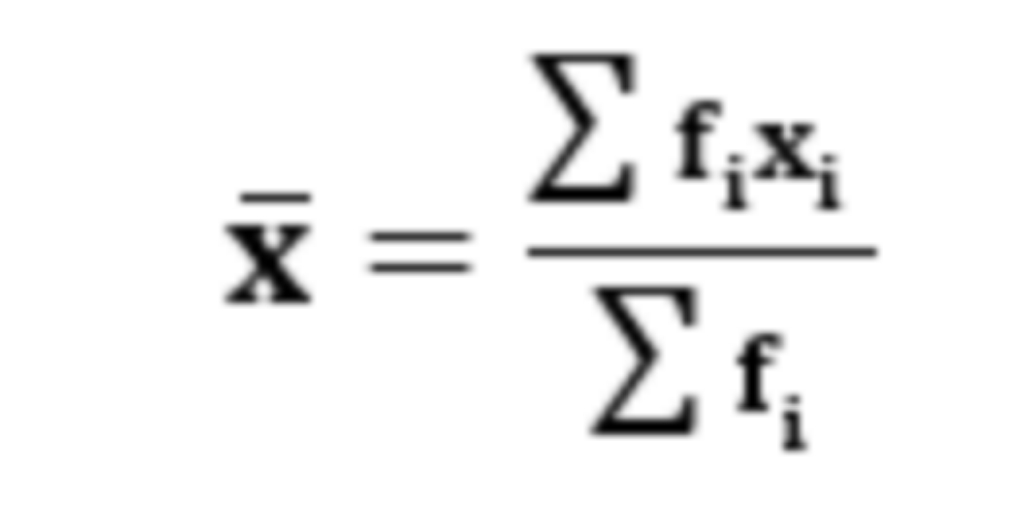
(ii) The assumed mean method=![]()
Where di = xi-a. a = Provisional mean
(iii) The step deviation method=![]() , where U1 = Xi-a/h
, where U1 = Xi-a/h
- Mode: The mode for the grouped data can be found by using the formula :

l = lower limit of the modal class.
f1= frequency of the modal class.
f0= frequency of the preceding class of the modal class.
f2 = frequency of the succeeding class of the modal class.
h = size of the class interval.
Modal class – class interval with highest frequency. - Median: Median of continuous series is:
(i) (N/2)th term (if number of terms are odd)
(ii) ½ [(N/2)th term + (N/2 + 1)th term] (if number of terms are even)
(iii) The median for the grouped data can be found by using the formula :
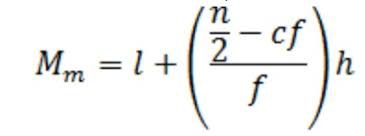
l = lower limit of the median class.
n = number of observations.
Cf = cumulative frequency of class interval preceding the median class.
f = frequency of median class.
h = class size.
4.Empirical Formula: Mode = 3 median – 2 mean.
5.Cumulative frequency curve or an Ogive :
(i) Ogive is the graphical representation of the cumulative frequency distribution.
(ii) Less than type Ogive :
• Construct a cumulative frequency table.
• Mark the upper class limit on the x-axis.
(iii) More than type Ogive :
• Construct a frequency table.
• Mark the lower class limit on the x-axis.
(iv) To obtain the median of frequency distribution from the graph:
• Locate point of intersection of less than type Ogive and more than type Ogive :
Draw a perpendicular from this point on x-axis.
• The point at which it cuts the x-axis gives us the median.